Online Step Line Chart Generator
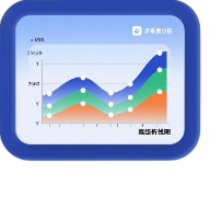
Professional step line chart maker with support for data import, multi-series comparison, custom styles, and HD image export, clearly showing phased trends in data changes.
Browser execution mode: Your data is processed in your browser and is not uploaded to the server.
Speed and Stability: Processing speed depends on your device and browser. For large batch work, the desktop version may be more stable.
Loading tool, please wait...
If the online tool fails to load or run, try the desktop tool.https://tools.yikeaigc.com/

Tool Usage
Return to old versionData source
Use the first column as the X axis; later columns create separate step line series.
Chart Settings
Step type affects the turning point position. Exported images use the width, height, and style set here.
Preview & export
The preview updates from current data. Download one image or batch ZIP the file list.
Click “Generate step line chart” to preview.
Instructions
Software Instructions
- Select a data source: You can use a manual table, pasted data, batch files, or sample data. The first column is used as the X-axis, and subsequent columns are used as different data series.
- Edit or import data:
- Manual table: Edit cells directly, add rows, add series, organize empty rows, or clear and refill.
- Paste data: CSV and TSV formats are supported. After pasting, click “Parse to Table”.
- Batch files: Supports selecting multiple CSV, TSV, and TXT files. The interface displays the first 20 files, and all files are included during processing.
- Set chart parameters: You can set the main title, subtitle, X-axis title, Y-axis title, step type, color theme, export width and height, label angle, Y-axis range, legend position, grid lines, data points, value labels, and background.
- Generate chart: Click “Generate Step Line Chart”. The tool will generate a preview based on the current data and style, and display information such as data series, valid point count, and value range.
- Export results: A single chart can be exported as PNG, JPG, or SVG. For batch files, charts can be generated using the original file names; if names conflict, numbers are automatically appended and the results are packaged as a ZIP download.
- Save settings: Click “Save Settings” to export the current configuration and table data, which can later be restored using “Load Settings”.