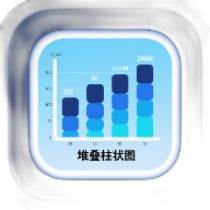
Stacked Bar Chart Generator
Create stacked bar charts online, with support for manual data entry and bulk CSV import, custom color themes, and export to PNG/JPG/SVG formats.
Browser execution mode: Your data is processed in your browser and is not uploaded to the server.
Speed and Stability: Processing speed depends on your device and browser. For large batch work, the desktop version may be more stable.
Loading tool, please wait...
If the online tool fails to load or run, try the desktop tool.https://tools.yikeaigc.com/
Tool Usage
Return to old version
Set up first
Generate charts after confirming data, style, and export format. CSV files are parsed only on this device.
1Choose data source
Use the first CSV row as headers, the first column as categories, and the rest as stacked series.
2Edit table data
Table actions
2Paste CSV data
2Select CSV files
Only the first 20 files are shown; all files will be processed when generating.
After data setup, go to style settings.
1Chart info
2Chart options
3Show details
4Series color
When custom color is selected, the color value below is fixed.
1Generate and export
Actions
Finish data and style settings first, then click “Generate chart”.
Single charts can be downloaded directly. Multiple CSV files are zipped by original file name.
Instructions
Software Usage Instructions
- Select a data input method: Choose "Manual Data Entry" to fill in the table directly, or choose "Import CSV File" to upload data files in bulk. Multiple CSV files can be processed at the same time.
- Configure basic chart information: Set the chart title, X-axis title, Y-axis title, and chart width. A chart width of 800-1200 pixels is recommended and can be adjusted as needed.
- Enter or import data:
- Manual entry: Select the number of categories and data series, then fill in the category names and corresponding values in the generated table
- CSV import: Upload a properly formatted CSV file, and the system will automatically parse it and populate the data table
- Set the chart style: Choose a preset theme (Classic Blue, Business Style, Vibrant Colors, etc.) or customize the color scheme, and adjust the font type and size.
- Generate the chart: Click the "Generate Stacked Bar Chart" button, and the system will generate a visualization chart based on the data and style settings.
- Download the chart: Select PNG, JPG, or SVG format to download a single chart, or click "Download All Charts (ZIP)" to download all generated charts in bulk.
FAQ
A: The first row of the CSV file should be the header row, the first column should be category names, and the remaining columns should be data series. For example: Category, Series 1, Series 2, Series 3. Fill in the category names and values in the data rows, and make sure the values are in plain numeric format.
A: It supports combinations of 3-10 categories and 2-5 data series. Categories represent grouped items on the X-axis, while series represent different data dimensions within each category. Series data will be displayed in stacked form within the same bar chart.
A: The system provides preset themes such as Classic Blue, Business Style, Vibrant Colors, Natural Green, Warm Tones, and Cool Tones. Each theme uses a different color scheme. Business Style is suitable for formal reports, while Vibrant Colors is suitable for presenting active data. You can also choose a custom theme to adjust the color of each series.
A: No. All data processing and chart generation are completed locally on your device. CSV files and input data are not uploaded to the server, ensuring your data privacy and security.
A: Downloads are supported in PNG, JPG, and SVG formats. PNG supports transparent backgrounds and is suitable for web use; JPG files are smaller and suitable for inserting into documents; SVG is a vector format suitable for printing and scaling.
A: Select the "Import CSV File" mode to upload multiple CSV files at once. The system will generate a separate stacked bar chart for each file. Once complete, you can download all charts as a package using the "Download All Charts (ZIP)" button.
A: In the "Chart Configuration" step, you can set the chart width, ranging from 400 to 2000 pixels. The chart height will be automatically adjusted to an ideal proportion based on the width. Recommended choices by use case: 800px for web display, 1200px for PPT insertion, and 1600px or above for print output.
A: Stacked bar charts are suitable for showing the composition of parts within different categories, such as sales broken down by product and region, budgets categorized by department and project, or personnel distributed by position and skill. They clearly display both the total and the proportion of each part.