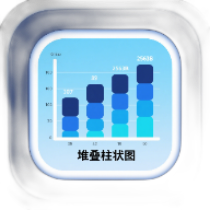
Stacked Bar Chart Generator
Create stacked bar charts online, supports multi-series comparisons, CSV import for batch generation, and offers multiple theme styles
Browser execution mode: Your data is processed in your browser and is not uploaded to the server.
Speed and Stability: Processing speed depends on your device and browser. For large batch work, the desktop version may be more stable.
Loading tool, please wait...
If the online tool fails to load or run, try the desktop tool.https://tools.yikeaigc.com/
Tool Usage
Return to old version
Set up first
Generate charts after confirming data, style, and export format. CSV files are parsed only on this device.
1Choose data source
Use the first CSV row as headers, the first column as categories, and the rest as stacked series.
2Edit table data
Table actions
2Paste CSV data
2Select CSV files
Only the first 20 files are shown; all files will be processed when generating.
After data setup, go to style settings.
1Chart info
2Chart options
3Show details
4Series color
When custom color is selected, the color value below is fixed.
1Generate and export
Actions
Finish data and style settings first, then click “Generate chart”.
Single charts can be downloaded directly. Multiple CSV files are zipped by original file name.
Instructions
Software Usage Instructions
- Select a data source: Choose manual input, paste CSV, or upload a CSV file. The first row of the CSV is the header, the first column is the category, and the remaining columns are stacked series.
- Edit chart data: In manual mode, you can adjust the number of categories and series, add categories, add series, or load sample data.
- Set chart style: Enter the chart title, subtitle, X-axis title, and Y-axis title, and choose a vertical stacked column chart or a horizontal stacked bar chart.
- Select stacking method: Use value stacking to show cumulative totals, or percentage stacking to show each series’ share within a category.
- Adjust display details: Set the sorting method, legend position, grid lines, total labels, segment values, background color, chart size, and series colors.
- Generate chart: Go to the preview and export step, then click “Generate Chart” to view the result. If the data comes from multiple CSV files, the system will generate multiple charts.
- Download results: A single chart can be downloaded as PNG, JPG, or SVG; after generating charts from multiple CSV files, click “Download All Charts ZIP” to save them as a package.
FAQ
A: The first row of the CSV is the header, the first column contains category names, and the following columns contain each data series. For example: Quarter,East China,South China,North China; Q1,120,95,80.
A: Value stacking is used to show the cumulative total and individual values for each category; percentage stacking is used to show the proportional structure of each series within each category.
A: Yes. In the style settings, switch the chart direction to “Horizontal Stacked Bar Chart,” which is suitable for data with long category names or a large number of categories.
A: During batch generation, the original CSV file name will be used as the result file name. If duplicate names occur, a number will be added after the file name to distinguish them, and the files will be packaged as a ZIP download.
A: PNG, JPG, and SVG are supported. PNG is suitable for transparent backgrounds or document illustrations, JPG for smaller files, and SVG for charts that need further editing or enlargement.
A: Yes. Numeric columns support integers and decimals, as well as numbers with thousands separators. It is recommended not to use negative numbers for data intended for stacked displays.