Funnel Chart Generator
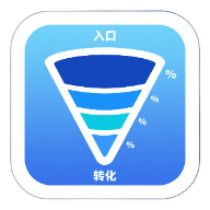
Create funnel charts online, supporting multi-scenario data visualization such as sales funnels, marketing conversions, and business processes, with multiple themes and export formats.
Browser execution mode: Your data is processed in your browser and is not uploaded to the server.
Speed and Stability: Processing speed depends on your device and browser. For large batch work, the desktop version may be more stable.
Loading tool, please wait...
Loading tool, please wait...
If the online tool fails to load or run, try the desktop tool.https://tools.yikeaigc.com/
Tool Usage
Return to old versionSet data and chart options before generating. Each step has a Next button at the bottom; follow the order for more stable results.
1Choose data source
Funnel stages should usually be arranged top to bottom by process, with values decreasing step by step.
| Stage name | Value | Color | Note | Action |
|---|
Supports comma, Tab, semicolon, or space separators. First column is stage name, second is value. Header row is skipped automatically.
Click to choose files or drag them here
Supports CSV, XLSX, and XLS. Batch files are all processed; only the first 20 are previewed.
File format: first column is stage name, second is value, third optional color, fourth optional note. Each file creates one chart; batch results can be downloaded as a package.
2Set Chart Options
3Generate, preview & export
Number of stages0
Start value-
End value-
Overall conversion rate-
Chart preview
Set data and parameters first, then click "Generate funnel chart".
Instructions
Software Usage Instructions
- Prepare stage data: Choose manual input, paste data, file import, or sample data. Enter stage names in the first column and values in the second column. Colors and notes can be set as needed.
- Check data order: Funnel charts are usually arranged from top to bottom according to the business process. You can also use “Sort by value” or choose the data order in the chart settings.
- Set chart parameters: Configure the title, subtitle, unit, color theme, funnel shape, export size, label font size, segment spacing, and background color.
- Select displayed content: You can control display items such as the title, values, overall conversion rate, stage conversion rate, legend, reference line, transparent background, and watermark.
- Generate the funnel chart: Go to the “Generate & Export” page, click “Generate Funnel Chart” to view the preview, and check the number of stages, starting value, ending value, and overall conversion rate.
- Export results: You can download a PNG image, SVG vector graphic, or CSV data. When importing multiple files in bulk, a ZIP archive can be generated, and the result file names will preserve the original file names as much as possible.
- Save common settings: Click “Save Settings” to keep the current chart parameters and data. Next time, you can click “Load Settings” to continue using them.
FAQ
A: They are suitable for displaying staged data such as sales processes, marketing conversions, user registration paths, e-commerce purchase processes, recruitment screening, and business approvals, helping you observe quantity changes and conversion performance at each stage.
A: CSV, XLSX, and XLS files are supported. The first column should contain stage names, the second column values, the third column can contain colors, and the fourth column can contain notes. Header rows will be automatically recognized and skipped.
A: The overall conversion rate is based on the value of the starting stage, while the stage conversion rate is based on the value of the previous stage. For example, if the first stage is 1000 and the second stage is 420, then both the overall conversion rate and stage conversion rate for the second stage are 42%.
A: We recommend using 2 to 10 stages. Too few stages make it difficult to show process changes, while too many stages reduce chart readability. You can merge detailed steps into key milestones.
A: Yes. After selecting multiple CSV or Excel files, the tool will read the data from each file and generate results in batches. When downloading the ZIP, it will try to preserve the original file names, and automatically add numbers to distinguish duplicate names.
A: PNG is suitable for use in documents, PPTs, and image assets; SVG is suitable for scenarios that require zooming, editing, or layout. If you need to make further adjustments in design software later, we recommend exporting as SVG.