Online Line Chart Maker
Create professional line charts online with data import, style customization, and animation effects. Export in multiple formats.
Browser execution mode: Your data is processed in your browser and is not uploaded to the server.
Speed and Stability: Processing speed depends on your device and browser. For large batch work, the desktop version may be more stable.
Loading tool, please wait...
If the online tool fails to load or run, try the desktop tool.https://tools.yikeaigc.com/

Tool Usage
Return to old versionSet data first, then adjust chart style, and finally generate and download. Sample data can be loaded directly. CSV/Excel files are parsed on this page.
1Select Data Source
First column as X-axis, following columns as data series; first row can be headers.
Click to select a CSV/Excel file, or drag it here
First column is X-axis, others are line data; select multiple files at once
The UI shows up to the first 20 files. All files are processed when generating batch results. Duplicate filenames get numbers automatically.
2Data Preview
After setting data, go to the style page to adjust title, axes, legend, and colors.
1Basic Settings
2Canvas & axes
3Colors & markers
1Generate & Save
2Batch Export
If multiple CSV/Excel files are imported, you can generate one chart for each file and download them as a package. File names match the originals by default; duplicates get a number automatically.
You can also download directly with the PNG, JPG, SVG, PDF, HTML, and JSON buttons in the preview area on the right.
Chart Preview
Set data, then click Generate Chart.
Instructions
Software Usage Instructions
- Select a data source: You can use manual input, paste a table, import a CSV/Excel file, or load sample data. It is recommended to complete the data settings first, then adjust the style and generate the chart.
- Manually enter data: Enter categories or times line by line in the X-axis labels, and enter the corresponding values line by line in each data series. To create multiple line charts, click “Add Data Series”.
- Paste or import a table: The first column of the table is used as the X-axis, and the following columns are used as line data series; the first row can be used as the header. CSV, XLSX, and XLS files are supported. When importing multiple files, ZIP files can be generated in batches.
- Set the chart style: You can configure the chart title, subtitle, X/Y-axis titles, line type, theme style, canvas size, line width, data points, gridlines, legend, value labels, and watermark.
- Generate the chart: Go to the “Generate & Export” page and click “Generate/Update Chart” to view the result. After modifying the data or style, you can click generate again to refresh the preview.
- Save and download: You can save the current settings for later reuse. A single chart can be exported as PNG, JPG, SVG, PDF, HTML, or JSON; after importing multiple files, they can be packaged and downloaded as a ZIP in batches.
Frequently Asked Questions
A: It is recommended that the first row be the header and the first column be the X-axis labels, such as months, dates, or category names; the second column and onward should be value columns, with each column generating one line.
A: When entering data manually, click “Add Data Series”; when importing a table, place multiple sets of data in different columns, and the tool will generate multiple lines by column. This is suitable for comparing data such as sales, visits, and costs.
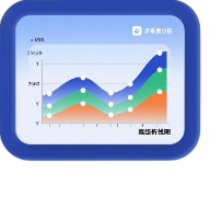
A: A basic line connects data points with straight lines; a smooth line uses curves to show changes; a step line is suitable for data that changes only after a certain point; an area line fills the area below the line with color.
A: Please check whether the number of X-axis labels matches the number of values in each series, and make sure the values do not contain unrecognized text. If the labels are long, you can increase the canvas width or set the X-axis label angle.
A: PNG is suitable for reports and web images; JPG is suitable for smaller image files; SVG is suitable for vector graphics that need to be enlarged or edited; PDF is suitable for archiving and printing; HTML is suitable for preserving a standalone page; JSON is suitable for saving data and configuration.
A: Batch export generates chart files based on the original file names. If duplicate names occur, a number is appended to the file name to distinguish them, and the results are packaged together as a ZIP.
Related Tools
Animated Bar Chart Race Generator
Generate animated bar chart races online, with JSON/CSV/E...
Online Step Line Chart Generator
Professional step line chart maker with support for data ...